
Our galaxy is called the Milky Way galaxy, and spans a distance of 150,000 light years. We estimate that the stars in the Milky Way number between 100 billion and 200 billion. This is a staggering number of stars. The population of stars is constantly changing, with new stars being born from the dust and gas present and old stars finishing their lives. In this chapter, we will examine the properties of stars in general. We will begin by reviewing the relationship between luminosity and brightness, and the magnitude scale. We will see how carefully observing characteristics of the stellar spectrum allows us to break up the populations of stars into classes. We will learn about the relationship between the mass of a star and how long it will continue to harbor fusion in its core. We will learn about the main sequence, along which most stars spend most of their lives, and how analysis of stars, using the Hertzsprung Russell diagram, allows us to calculate distances to stars that are too far away to be able to use stellar parallax.
1,000 light years
© 2005 Pearson Prentice Hall, Inc
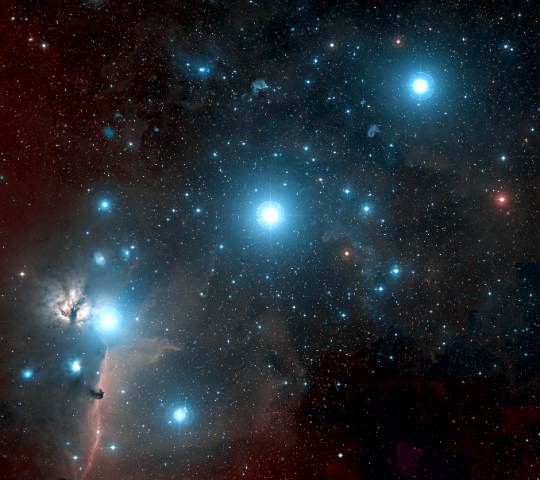
The three bright stars in Orion's belt are called Alnitak, Alnilam and Mintaka. They are blue supergiant stars, very much hotter and more massive than our sun. As you can see from the side view diagram, even though they look to be about the same brightness, Alnilam is about 500 light years farther away from us than Alnitak. This means that Alnitak must be putting out more light. In other words, stars with the same apparent brightness can have different luminosities, if they are different distances away.
The relationship between luminosity and apparent brightness (or how bright a star appears to us) is based on the inverse square law of light. We also sometimes refer to luminosity as absolute brightness, or how bright a star would look to us if it was ten parsecs away.
Comparing luminosity and magnitude
Astronomers sometimes use another scale, called the Magnitude Scale, to describe how bright a star looks to us. The magnitude scale also has an absolute and apparent magnitude, like the brightness scale. The above diagram shows the correlation between luminosity and absolute magnitude. Notice that as the values for luminosity get bigger, the absolute magnitude valued get smaller, and even become negative. This may seem counterintuitive, that a higher value of magnitude actually refers to a dimmer star. Also, notice that when comparing the two scales, the luminosity scale increases by powers of ten, while the magnitude scale decreases linearly.
Note: Larger number means
DIMMER star
Absolute magnitude is the magnitude we would see if the star was 10 parsecs away
Blackbody curves
Recall what we learned about blackbody curves in chapter 3, and that Wien's law gives the relationship between the peak wavelength of the blackbody spectrum and the surface temperature of a star.
Blackbody curves tend to take characteristic shapes. Because we understand the shapes of the blackbody curves, we can calculate the peak wavelength by finding the ratio of two wavelengths, say the blue and the violet.
Strong absorption lines for singly ionized He
Weak H lines, mostly ionized
H lines strongest
H lines weak, not hot enough to excite electrons
© 2005 Pearson Prentice Hall, Inc
Careful study of absorption lines in stellar spectra can give us clues about the abundance of elements in the stars' atmospheres as well as the atmospheric temperatures. For example, the bar across the top of the diagram above indicates which of the absorption lines correspond to the excited states of hydrogen atoms. If you follow the second line for hydrogen, in about the center of the spectra, you can see that it is the darkest in the stars with surface temperatures of 7000 - 10,000 Kelvin, where the temperature tends to excite the electrons in hydrogen atoms. If the temperature is much higher, the line becomes weak, because these temperatures are high enough to ionize many of the hydrogen atoms, stripping away the electrons, so they are not present in the excited states. For much lower temperatures, the line is again weak, but this time it is because the gas is too cool to excite many electrons.
You can follow similar trends involving other elements. Once we learn what these absorption lines are telling us about stars that we understand well, we can apply what we have learned to stars in general. This allows us to designate classes of stars based on spectral line analysis.
© 2005 Pearson Prentice Hall, Inc
This diagram summarizes the spectra of the various designated spectral classes, O, B, A, F, G, K and M, with O type stars being the hottest and M type stars being the coolest. The number following the letter breaks down the class into subdivisions by temperature. For example, a B8 star is hotter than a B7 star. The sun is a G2 star. The far right column gives a representative star for the class. For example, HD 12993 is an O type star.
© 2005 Pearson Prentice Hall, Inc
This table summarizes some of the characteristics of the spectral classes. Note how the hydrogen lines are faint for the hottest stars (O type) and get stronger as the temperature drops. The strongest Hydrogen lines are for A type stars, then grow fainter as the temperature drops.
For the hottest stars, absorption lines for multiply ionized heavy elements are present, while for somewhat cooler stars, absorption lines for singly ionized heavy elements are present. Singly ionized elements have lost one electron, while multiply ionized elements have lost more than one electron. You would expect a hotter star to have more electrons given enough energy to become freed from the atoms, so it makes sense that for the very hot stars, elements would be multiply ionized.
We can use this information to analyze stars via spectral analysis. For example, if we see in the spectrum of a star that absorption lines are present for energy levels of multiply ionized heavy elements, we can assume that it is a very hot star.
Image source: 21space.info/stars
Wien's law relates the peak wavelength of the star's spectrum to its temperature. The peak wavelength corresponds to the color of light that is most abundant. The spectral classification of stars can be used to determine the color of a star. This diagram shows the colors of the spectral types of the stars. It should be noted that there are other spectral classification schemes, but this scheme (OBAFGKM) is most commonly used by astronomers today.
Many different mnemonics can be used to remember the order of the spectral classes, such as the one above.
Stars come in a wide variety of sizes, temperatures, and luminosities. We can use our observations of these characteristics to calculate very useful information about stars, such as how far away they are, and how long they live. In this section, we will study the basic properties of stars in general and the information gleaned from these observable properties.