Concepts of motion
We begin our study of classical mechanics by investigating motion at its most fundamental level.

Most real motion of objects is extremely complicated. Different parts move at different speeds, and in different directions. To begin to investigate motion, we will make a simplifying assumption that objects in motion can be treated as particles.
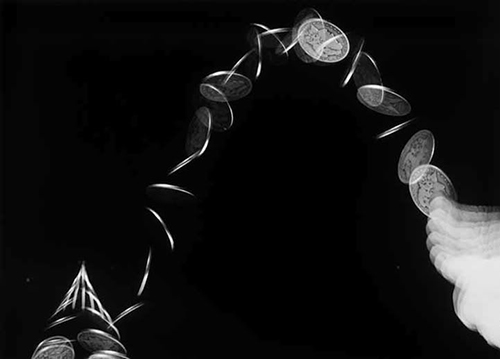
By considering objects as particles, we are neglecting information about size or extent of the object. In essence, we treat extended objects as point particles. If you throw a rotating extended object, such as a coin, the center of mass of the object will follow a simple trajectory. By treating the object as a point particle, we are investigating the motion of its center of mass.

When a bouncing ball nears the top of its trajectory, its upward motion slows. It speeds up as it falls. This change in speed can be seen in a stroboscopic photograph as the change in the distance between successive images of the object. We can use strobe diagrams to visualize changes in speed. It is important to note that the strobe uses the same change in time between each successive pair of images.
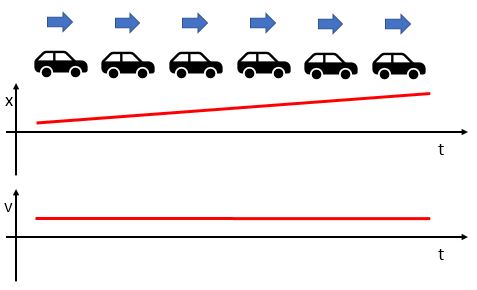
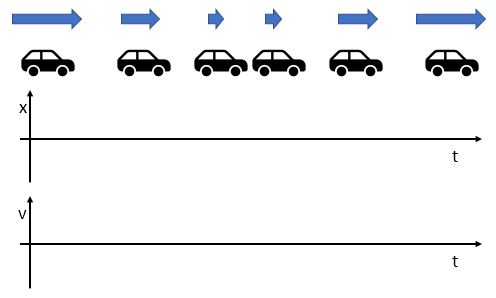
Strobe diagrams can be used in conjunction with position vs. time and velocity vs. time graphs to provide multiple ways of representing the same motion. Here, the spacing between the cars is the same throughout the strobe diagram. The lengths of the arrows above the car depict the magnitude of the velocity, or the speed. The correlating x vs. t graph shows a constant change in position, while the v vs. t graph shows constant positive velocity.
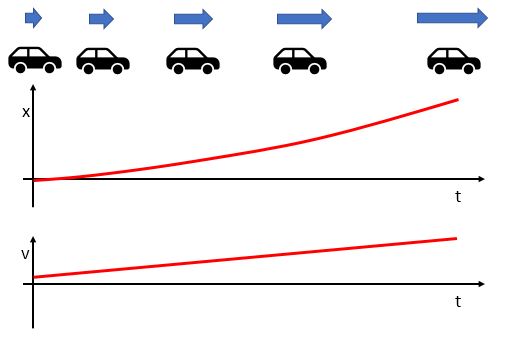
This strobe diagram shows increasing spacing for the car, so it must be speeding up. The velocity vs. time graph shows a constantly increasing positive speed. The corresponding position vs. time graph is parabolic with upward concavity. This car is moving away from the origin, since the x value is getting larger with time. The sign of the velocity is determined by the direction of the motion.
Note that there is a distinction between the two diagrams: the strobe diagram has one image for each equal delta t. The x vs. t and v vs. t graphs also have equally spaced time increments, but unlike the strobe diagram, they are equally spaced along the axes. The two ways of visualizing motion are qualitatively correct, but you cannot make a direct vertical comparison.
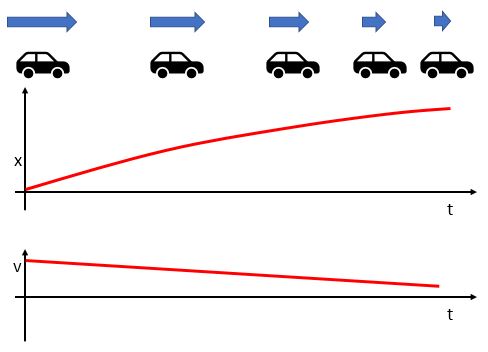
This car is moving in the positive direction and slowing down at a constant rate. Its velocity vs. time graph shows positive velocity with a constant negative slope. The corresponding x vs. t graph is positive and increasing, and concave down. Notice that the slope of the x vs. t graph is decreasing as the v vs. t graph decreases in value.
Please describe the motion of this car in words and draw the correlating position vs. time and velocity vs. time graphs.
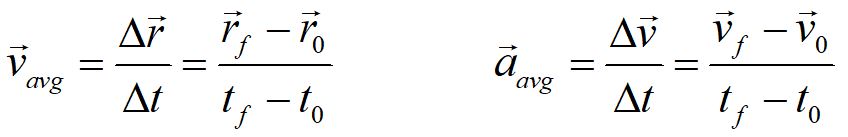
We define the average velocity as the displacement (change in position) divided by the change in time, and the average acceleration as the change in velocity over the change in time.
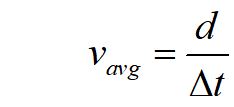
Average speed is the distance traveled divided by the time interval. This is a scalar quantity and not the same as average velocity.
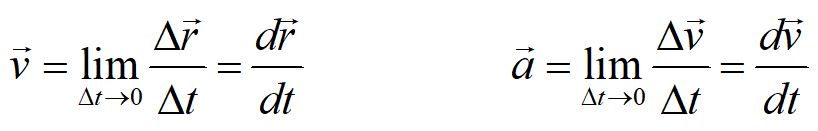
Taking the limit as the change in time goes to zero gives us the corresponding instantaneous velocity and acceleration.